
Andropause Prevalence
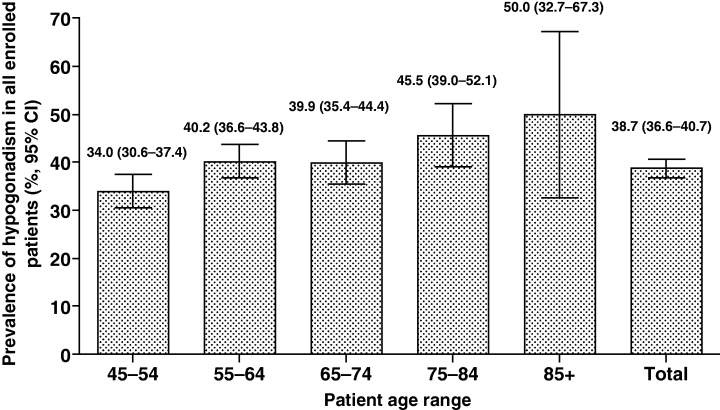
There is no clear image of prevalence of hypogonadism, largely due to differences in study populations and diagnostic criteria. Many studies reveal consistent findings across different populations and time periods. The landmark HIM study by Mulligan et al. reported a 38.7% prevalence rate in American men aged 45 years and older visiting primary care practices, while a recent Turkish multicenter study found a remarkably similar 38.5% prevalence rate in men aged 50-75 years attending urology clinics. At the same time a comprehensive systematic literature review examining 97 studies found that chemical hypogonadism (low-T) prevalence in the general population ranged from 2.1% to 12.8% among middle-aged to older men in Europe and the USA, with higher rates observed in patients with comorbid conditions such as diabetes and obesity.
The Treatment Gap
The treatment gap represents a massive "invisible epidemic" with up to 80-92% of hypogonadal men remaining undiagnosed or untreated. The underestimation and underdiagnosis of andropause and hypogonadism result in a significant treatment gap, with many symptomatic men missing out on beneficial interventions due to inadequate screening and awareness. Based on epidemiological reviews, while reported prevalence of symptomatic hypogonadism is 2-5% in older men, the true figure may be 10-15% or higher when accounting for undiagnosed cases driven by inconsistent testing and nonspecific symptoms. See studies: Andropause in Diabetic and Non-diabetic Males, Epidemiology of Male Hypogonadism.
Underestimation is also indicated by he high prevalence of obesity and type 2 diabetes (T2D) in Western populations, which are strongly correlated with low testosterone levels and secondary hypogonadism. Obesity is estimated to affect over 20% of adults in 33 European countries, with global adult obesity at around 16-22% and T2D prevalence rising to 8-9% in many high-income nations. These conditions exacerbate testosterone decline through mechanisms like insulin resistance and inflammation, yet routine testosterone screening in obese or diabetic men remains infrequent, further contributing to underdiagnosis.
Lastly, these diagnoses are typically based on total testosterone, not free testosterone, which excludes even more cases since free testosterone can be low while total is not, potentially underestimating prevalence by an extra 10-30% in some populations.
The U-shaped Risk Hypothesis
Testosterone levels could have a U-shaped association with all-cause mortality, with optimal levels plausibly between 16–30 nmol/L (460-860 ng/dL). Below this range mortality risk appears to rise via metabolic dysfunction, including higher risks of type 2 diabetes, cardiovascular disease, and inflammatory processes. Above this range the risk through erythrocytosis (hematocrit elevation) with attendant thrombotic mechanisms and potential cardiovascular strain may increase.
While not scientifically proven and lacking formal consensus, the overall hypothesis is scientifically sound. Elevated risk at low testosterone is robust in large epidemiological cohorts, including older men and high-risk groups. At very high (supraphysiological) levels, evidence is sparser and largely mechanistic or indirect (e.g., TRT-induced erythrocytosis), but remains biologically plausible; few men naturally sustain such levels, limiting observational data. The curve pragmatically conveys an ‘optimal’ band where mortality risk is lowest.
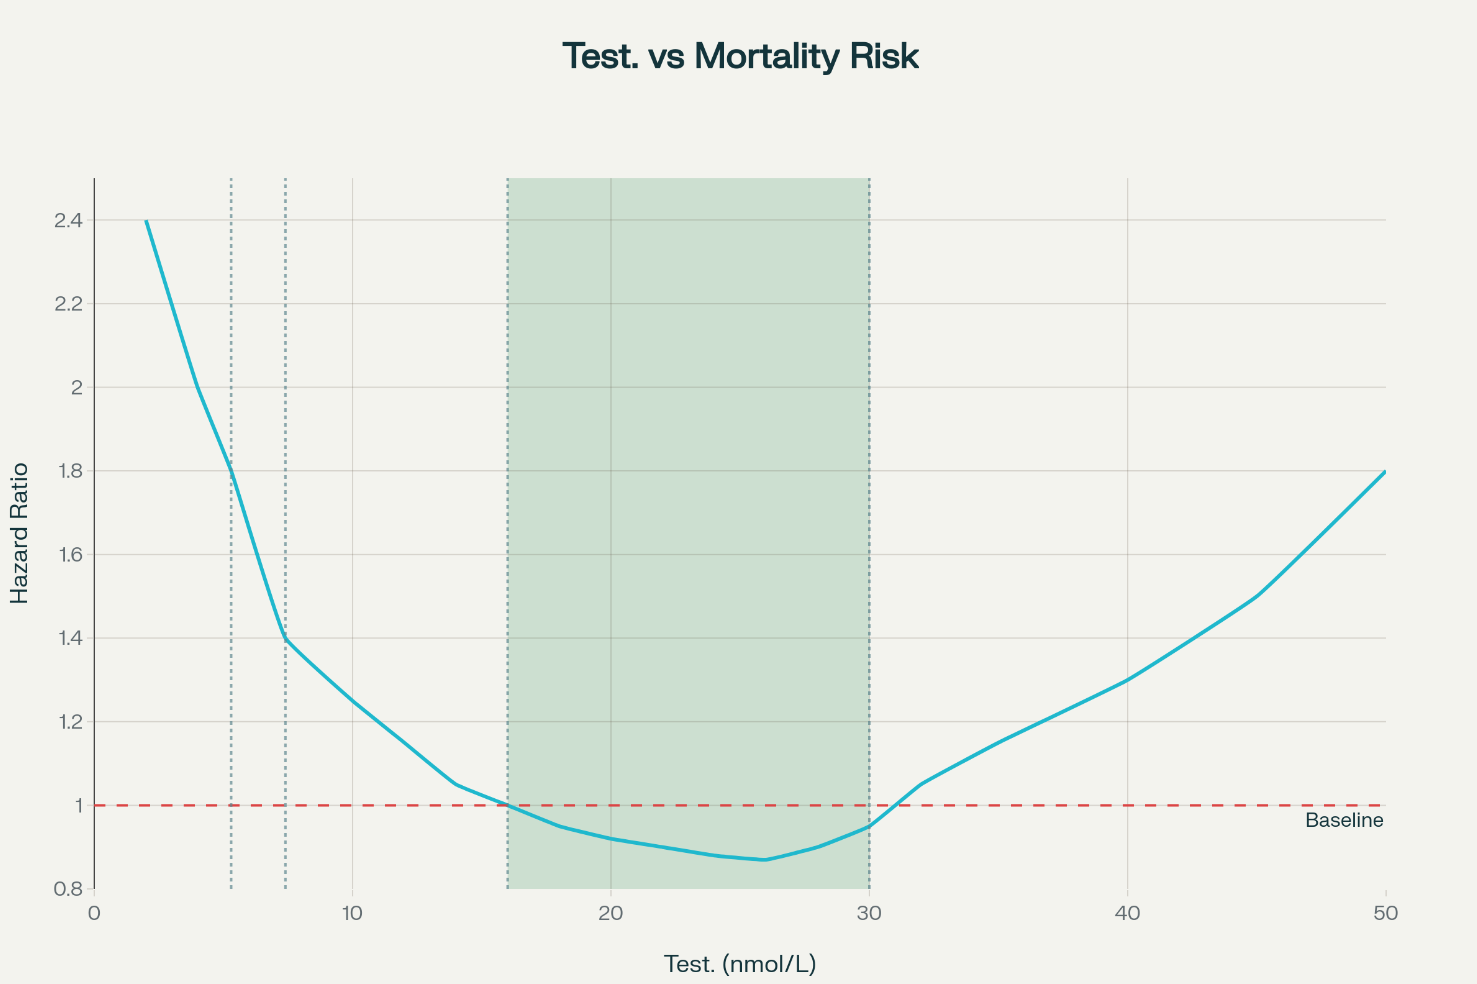
This image is AI generated and not based on actual data, it visualizes the hypothesis.
The Vicious Cycle of Low-T
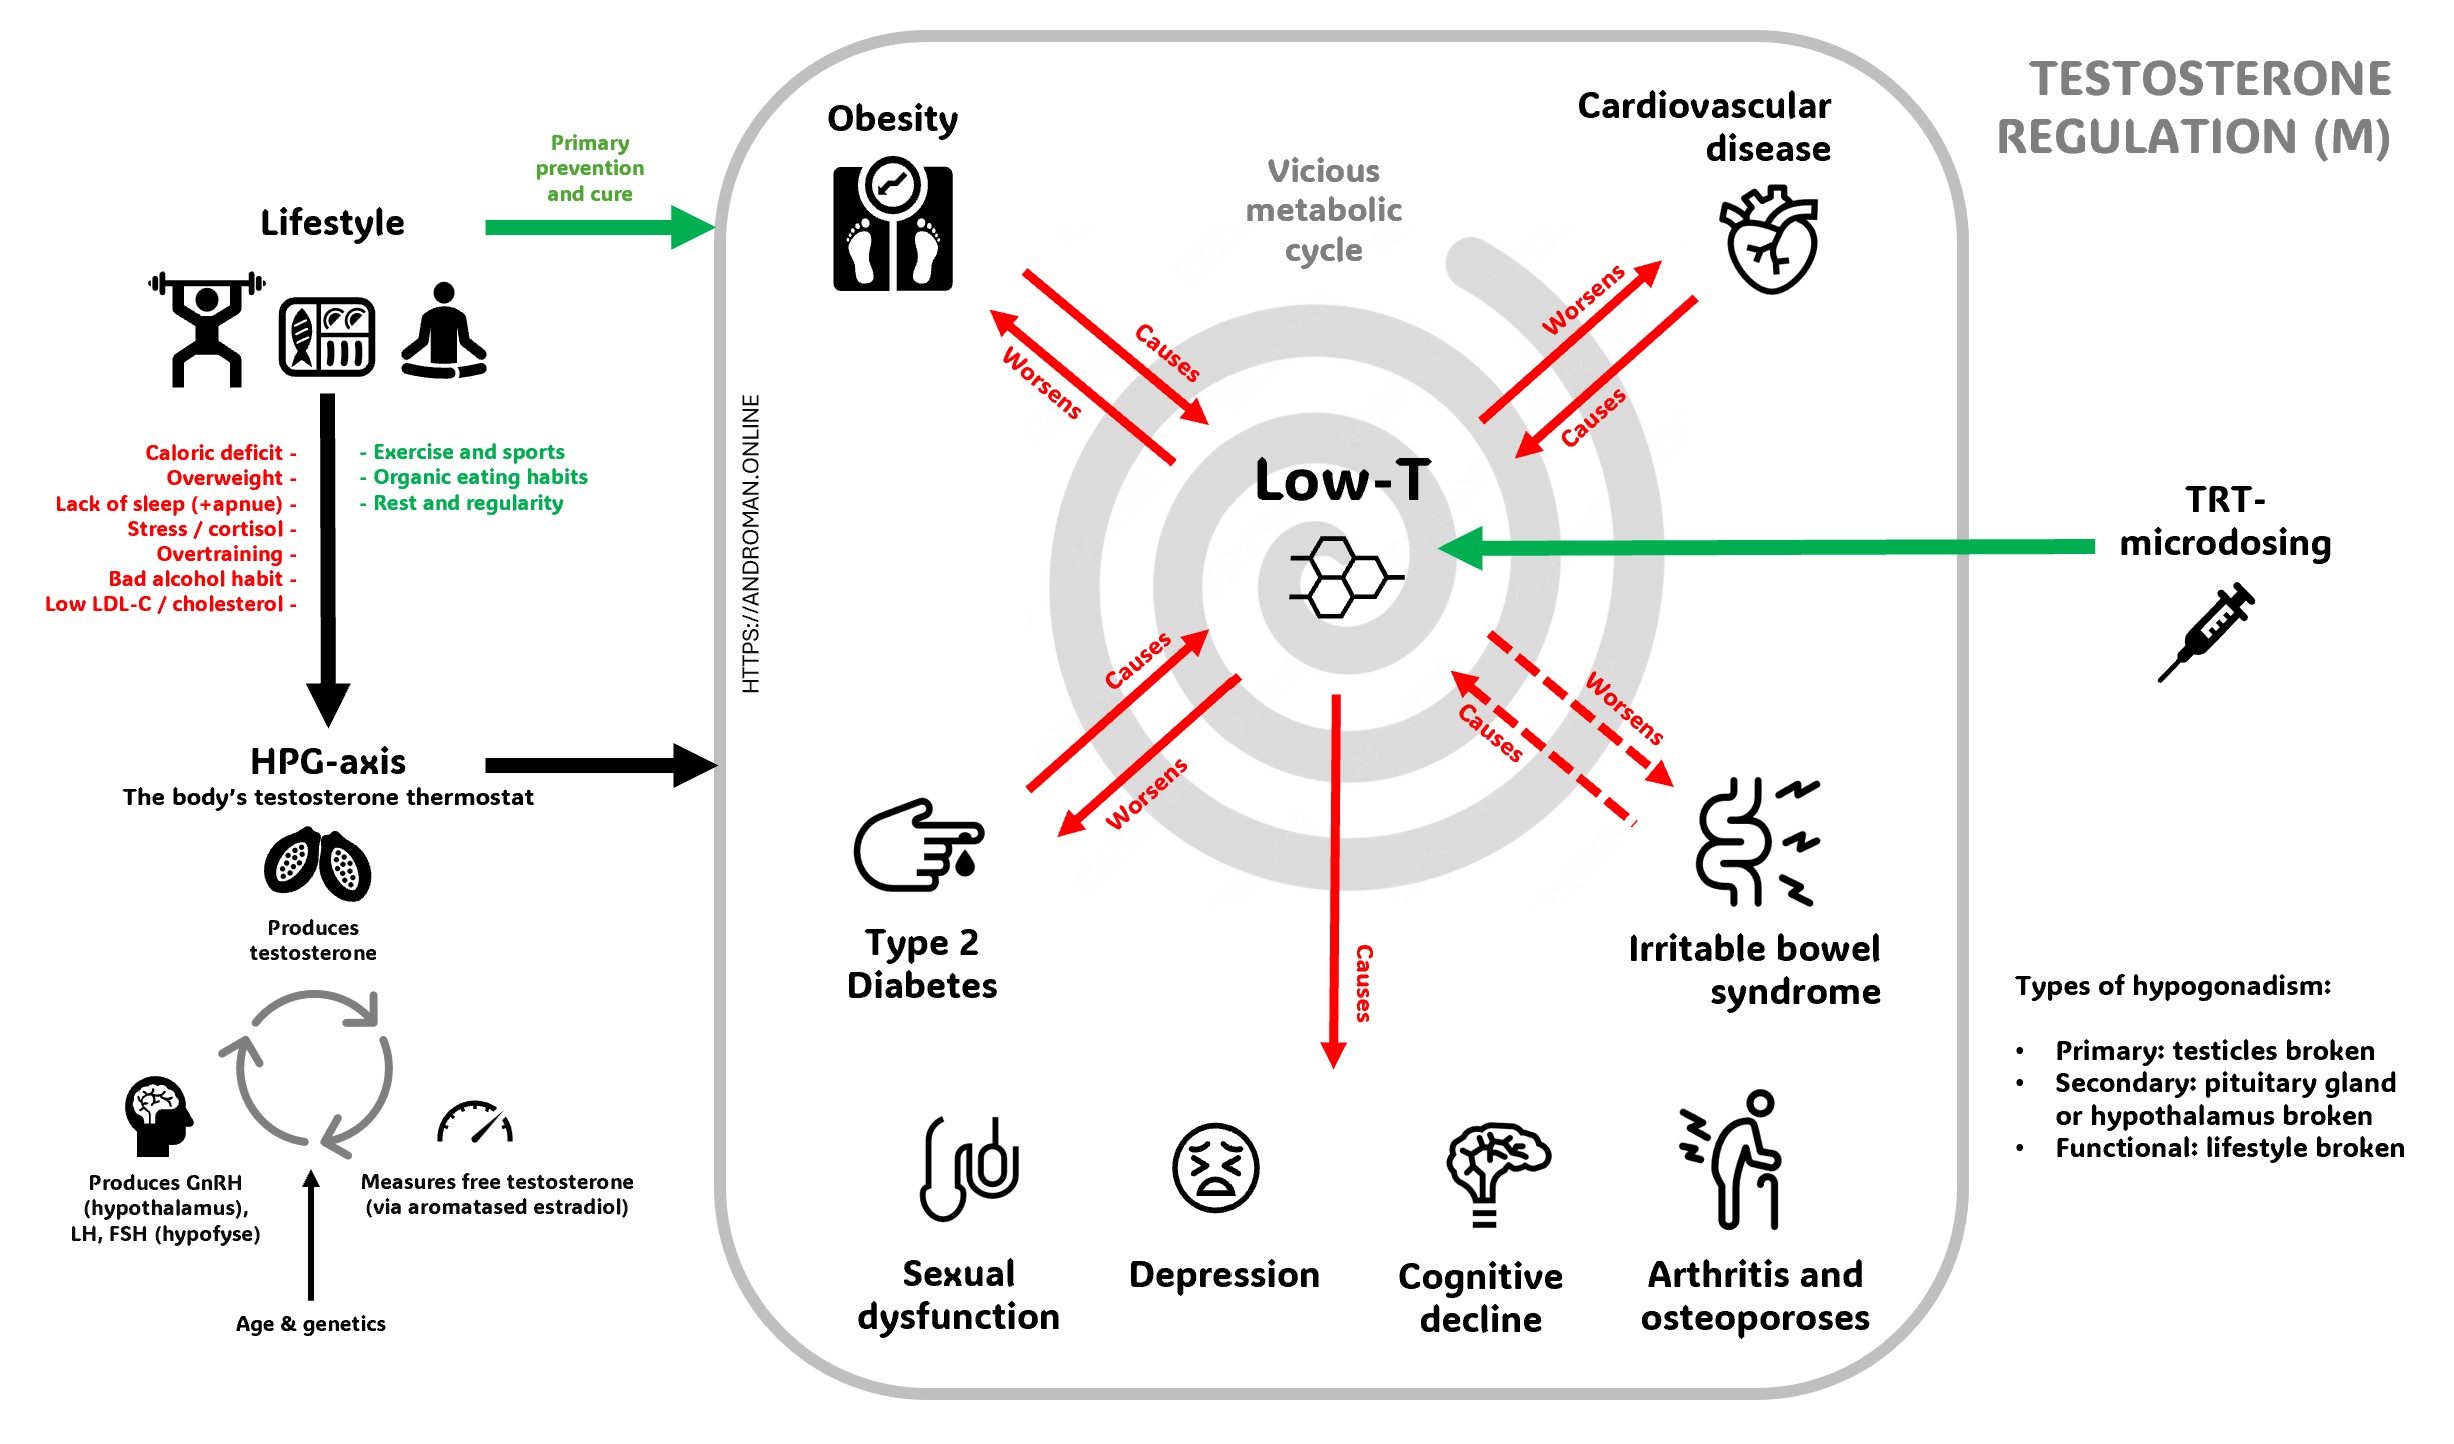
Low testosterone creates a destructive cycle where multiple health conditions feed into each other, making the problem progressively worse. When testosterone levels drop, men commonly experience decreased energy, muscle loss, weight gain (especially around the belly), depression, cognitive problems, and sexual dysfunction including reduced libido and erectile difficulties. This hormonal decline also increases the risk of developing serious conditions like diabetes, cardiovascular disease, and metabolic syndrome. The excess body fat that accumulates converts testosterone into estrogen and produces inflammatory substances that further suppress testosterone production, while conditions like diabetes and obesity directly interfere with the body's natural testosterone manufacturing process
The cycle becomes self-perpetuating because low testosterone symptoms make it harder to maintain healthy lifestyle choices that could naturally boost hormone levels. Fatigue and depression reduce motivation for exercise, muscle weakness makes physical activity more difficult, and poor sleep quality disrupts the body's hormone production cycles. However, this cycle can be broken through targeted interventions including testosterone replacement therapy when appropriate, combined with lifestyle modifications like regular exercise, weight management, stress reduction, and adequate sleep. These approaches work synergistically - testosterone therapy can provide the initial energy and motivation needed to make lifestyle changes, while healthy habits support natural testosterone production and enhance the effectiveness of any medical treatment.
Cardiovascular disease
Men with low-T have an increased risk of preterm death, mainly due to cardiovascular causes
GotoOfficial Male Testosterone Ranges by Country
Note: For free testosterone, we use 420 pmol/L (120 pg/mL) as the lower limit, higher than typical guidelines (210 pmol/l). This matches the low end of the reference range for men aged 19-39 years, which should be the target for optimal health, rather than lower values from elderly men with age-related declines. It is also consistent with how the harmonized total testosterone reference range is determined. Applying this principle of benchmarking against a young, healthy population provides a logical methodology for defining a target for optimal health rather than simply avoiding a clinical diagnosis.See the highlighted table entries below for scientific validation.
| Country/Organization | Range (nmol/L) | Range (ng/dL) | Age Group | Document |
|---|---|---|---|---|
| USA Endocrine Society |
9.2-31.8 | 264-916 | 19-39 years (healthy non-obese) | Harmonized Reference Range |
| USA AUA |
10-... | 300-... | Adult men (middle tertile) | Testosterone Deficiency Guideline |
| USA Mount Sinai |
10-35 | 300-1000 | Adult men | Health Library |
| USA CDC |
9.2-31.8 | 264-916 | 18+ years | Hormone Standardization Program |
| UK BSSM |
<8 (low) 8-12 (borderline) >12 (normal) |
<231 231-346 >346 |
Adult men | BSSM Guidelines on Testosterone Deficiency |
| UK NHS Oxford |
8.3-30.2 (19-49y) 7.7-24.8 (>49y) |
239-870 (19-49y) 222-715 (>49y) |
Age-specific ranges | Oxford University Hospitals NHS Trust |
| UK NHS Sussex |
8.64-29.0 (18-49y) 6.68-25.7 (≥50y) |
249-836 (18-49y) 193-741 (≥50y) |
Age-specific ranges | Sussex NHS Trust |
| UK NHS North Midlands |
6.85-23.23 (<50y) 6.51-23.74 (≥50y) |
197-670 (<50y) 188-684 (≥50y) |
Age-specific ranges | UHNM NHS Trust |
| Canada CUA |
14-17 | 403-490 | Adult men (treatment target) | CUA Guideline on Testosterone Deficiency |
| Canada British Columbia |
<8 (young men <30y) <6 (older men >50y) |
<231 (young) <173 (older) |
Age-specific cutoffs | BC Guidelines Testosterone Testing Protocol |
| Australia RACGP/ESA |
<8 (low) 8-15 (borderline with high LH) |
<231 231-432 |
Men over 40 years | RACGP/ESA Guidelines |
| Australia General Labs |
8.7-29 (18-49y) 6.7-25.7 (50+y) |
250-836 (18-49y) 193-741 (50+y) |
Age-specific ranges | Medichecks Reference Ranges |
| Europe EAU/EAA |
Variable (local lab ranges) | Variable | Adult men | EAU Guidelines on Male Hypogonadism |
| Free Testosterone International Study |
0.23-1.07 (all men) 0.42-1.27 (19-39y) |
66-309 pg/mL (all) 120-368 pg/mL (19-39y) |
Free testosterone ranges | Jasuja et al. Reference Intervals Study |
• Clinical symptoms must be considered alongside laboratory values
• Age-related decline is approximately 1% per year after age 30
• The Endocrine Society harmonized range (264-916 ng/dL) is considered the gold standard
• Click on document names to view the original guidelines
Official Guidelines on Testosterone Defficiency by Country
| Country/Organization | Year | Status | Key Features | Document |
|---|---|---|---|---|
|
Canada Canadian Urological Association (CUA) |
2021 | Current | Evidence-based Q&A format, 72-member expert panel, Canadian-specific content | CUA Clinical Practice Guideline |
|
USA American Urological Association (AUA) |
2018 | Updated regularly | Comprehensive guidelines, widely adopted in North America | AUA Testosterone Deficiency Guideline |
|
Europe European Association of Urology (EAU) |
2019 | Integrated into Sexual Health Guidelines | Part of broader sexual and reproductive health framework | EAU Sexual Health Guidelines |
| USA Endocrine Society |
2018 | Latest version | Evidence-based, cardiovascular safety focus, age-specific management for men ≥65 | Endocrine Society Practice Guideline |
|
International International Society for Study of Aging Male (ISSAM) |
2020 | Updated recommendations | Focus on aging male health, international consensus | ISSAM Clinical Guidelines |
|
Europe European Academy of Andrology (EAA) |
2020 | Functional hypogonadism guidelines | Distinguishes functional vs organic hypogonadism | EAA Functional Hypogonadism Guidelines |
|
UK British Society for Sexual Medicine (BSSM) |
2023 | Latest | 25 evidence-based statements, comprehensive UK guidance | BSSM Testosterone Deficiency Guidelines |
| Italy SIAMS/SIE |
2022 | Joint guidelines | GRADE methodology, adult-onset focus, collaborative approach | SIAMS/SIE Practice Guidelines |