Testosterone-Science
for health and longevity
ANDROMAN
Last Updated
2025-09-26 14:18:01
Biometric representation of lungs and cardiovascular system
The core physiological markers of aging are primarily linked to cardiovascular efficiency.

The 9 Fundamental Tests

Longevity fitness measures how well your physical condition reduces all-cause mortality risk and extends your healthspan—the years you live in robust health. It emphasizes consistent exercise that enhances core physiological markers of aging, such as cardiovascular efficiency and mitochondrial function. Functional and lifestyle metrics serve as the primary indicators for longevity because they directly and relatably reflect lifestyle, and because they are more holistic indicators than genetic or static blood markers.

The 9 biometrics below collectively cover key physiological domains most impacting aging: aerobic capacity, body composition, muscular dvelopment, power generation and functional mobility. Together, they represent over 90% of personal, trainable variability in longevity outcomes. Regular monitoring provides concise snapshots of your physiological aging and reduction or increase of health and mortality risks.

Notes sorted from higher risk reduction / better longevity to lower.

Push-up Capacity Test (PUT)

Optimal: ≥40 push-ups

Higher push-up capacity strongly predicts cardiovascular health, with ≥40 push-ups linked to markedly lower incidence of future CVD events.

Measured as the maximum number of consecutive push-ups completed without rest during a standardized baseline fitness assessment.

~60-80% reduction in mortality and 96% reduction in CVD event risk*

reference →
Cooper-test (CPT)

Optimal: >2200m (50-59 years)

Strongest predictor of cardiovascular health and longevity.This test is an effective and accurate subsitute for a direct VO2Max test, which itself takes a complicated calorimetry test.

Measured by running as far as possible on a firm flat surface in 12 minutes.

80% reduction in mortality risk*

see alternatives →
Sitting-Rising Test (SRT)

Optimal: >8 points (46-75 years)

Comprehensive assessment of non-aerobic fitness predicting natural and cardiovascular mortality, with 3.8-fold higher death risk for scores 0-4 versus perfect scores.

Measured by sitting on floor and rising to standing using minimal support, scored 0-10 points with deductions for hand/knee use and unsteadiness.

74% reduction in mortality risk*

reference →
Resting Heart Rate (RHR)

Optimal: <70 bpm

Independent predictor where rates ≥78 bpm show 3.5-fold increased cardiovascular mortality risk, reflecting cardiovascular efficiency.

Measured after 5+ minutes of seated rest using pulse palpation or heart rate monitor, counting for 60 seconds.

67% reduction in mortality risk*

reference →
Daily Step Count (DSC)

Optimal: ≥7,000 steps/day

Higher habitual ambulatory activity strongly predicts longevity, with ≥7,000 steps/day linked to markedly lower all-cause mortality.

Measured via smart watch over multiple days to capture habitual activity levels.

55% reduction in mortality risk*

reference →
Handgrip Strength (HGS)

Optimal: >40kg (50-59 years)

Powerful predictor with low grip strength associated with 40-70% increased mortality risk and reflects overall muscle strength and frailty.

Measured using hydraulic hand dynamometer with standardized arm position (90° elbow flexion), taking best of 2-3 trials.

41% reduction in mortality risk*

reference →
Body Fat Percentage (BFP)

Optimal: 14%<optimal<18% (50-59 years)

Superior to BMI for mortality prediction, with high body fat (≥27%) nearly doubling the risk. Too high causes testosterone aromatisation into estrogen. Too low risks caloric deficit.

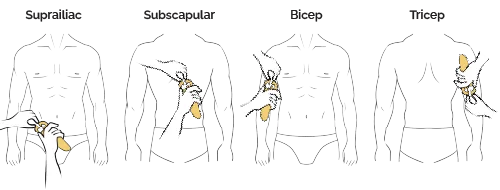
Measured via DEXA scan, bioelectrical impedance analysis, or skinfold calipers.

32% reduction in mortality risk*

reference →
Waist-to-Hip Ratio (WHR)

Optimal: <0.90 (men over 50)

Stronger predictor than BMI alone by capturing visceral fat distribution patterns that drive metabolic dysfunction and mortality risk. Research

Measured using tape measure at narrowest waist and widest hip circumference, calculated as waist ÷ hip measurement.

32% reduction in mortality risk*

reference →
30s. Chair Stand Test (30CST)

Optimal: >14 repetitions (50-59 years)

Functional lower body power and endurance test that correlates with leg-press strength (r=0.78) and predicts mobility limitations and independence.

Sit-to-stand repetitions in 30 seconds from standard chair without using arms. Below-average scores indicate elevated fall risk.

20% reduction in mortality risk*

reference →

* mortality risk reduction for middle-aged men when comparing high-end vs. low-end scores.

Essential Complementary Metrics

VO₂ Max

Measures cardiovascular capacity.

Represents the maximum volume of oxygen your body can metabolize during intense exercise. Holistic measure cardiorespiratory fitness and aerobic capacity. Measured via maximal treadmill or cycle ergometer test with gas analysis, or with smart watch. Smart watches usually exaggerate this value.

High VO₂ max strongly predicts reduced all-cause mortality risk. Robust evidence from large cohort studies supports its superior prognostic value for longevity.

See more →
Total/Free Testosterone

Measures lifestyle.

Arguably the most holostic biometric for health and longevity because it influences and is influenced by almost all processes in the body and even mind.

Optimal levels predict better physical function and reduced mortality in men. Evidence is strong but primarily observational, with some intervention plausibility.

reference →
DEXA Scan

Measures body composition.

Quantifies muscle mass, bone density, and visceral fat via dual-energy X-ray absorptiometry. Low-dose X-ray scan taking ~10 minutes. Visceral fat and low muscle mass strongly predict frailty and mortality.

High visceral fat and low muscle mass predict increased all-cause mortality. Strong evidence from cohort studies, including Health ABC, supports its prognostic value.

reference →
Apolipoprotein B (ApoB)

Measures vascular problems.

Measures atherogenic particle count via standard blood test using turbidimetric immunoassay. Superior to LDL-C for cardiovascular risk prediction; each particle drives plaque formation.

Elevated ApoB predicts higher cardiovascular mortality and overall longevity reduction. High-quality evidence from meta-analyses confirms superior predictive strength over traditional lipids.

reference →
HbA1c (Glycated Hemoglobin)

Measures metabolic dysfunction.

Reflects 2-3 month average glucose via blood test using HPLC or immunoassay. J-shaped relationship with mortality - both high (>7%) and very low (<6%) levels increase death risk.

Optimal range (5-6%) predicts lowest all-cause mortality. Strong evidence from large prospective studies confirms the J-shaped curve and metabolic impact.

reference →
hs-CRP (High-Sensitivity C-Reactive Protein)

Measures systemic inflamation.

Measures systemic inflammation via blood test using high-sensitivity immunoturbidimetric assay. Chronic elevation indicates "inflammaging" - the low-grade inflammation driving age-related disease.

Elevated hs-CRP predicts increased cardiovascular and all-cause mortality. Robust evidence from cohort studies supports its role in longevity assessment.

reference →

Scientific Longevity Calculator (Males)

Longevity Calculator

Enter your age and as many other metrics as availabe. More metrics make the result more reliable.

Cumulative Score:

Fitness Category:

Physiological Age:

Net Risk Change:

Robustness of Result:

Algorithm Explanation

Risk Calculation Methodology: The calculator uses age-adjusted percentiles to estimate mortality risk reduction from physical fitness metrics. Each input is converted to a population percentile using evidence-based normative data stratified by age groups (20-39, 40-59, 60+).

Absolute Risk Approach: Instead of multiplying relative risk reductions (which can unrealistically exceed 100%), the algorithm applies absolute risk reduction (ARR) values derived from longitudinal studies. Each metric contributes a specific ARR per 1000 person-years based on moving from the 25th to 75th percentile of performance.

Non-Linear Spline Modeling: Benefits follow evidence-based dose-response curves using restricted cubic splines rather than linear scaling. Major metrics like VO₂ max show steep initial benefits that plateau above the 75th percentile, while body composition metrics exhibit J-shaped curves where both extremes increase risk, reflecting real epidemiological patterns.

U-Shaped Body Fat Percentage Risk Body fat percentage follows a U-shaped risk curve where mortality risk is lowest within an optimal range (e.g., 12-20% for middle-aged men). Values below the lower optimal or above the upper optimal incur penalties, with stronger quadratic penalties applied outside the absolute bounds (e.g., below 10% or above 27%). This models the increased risks from both excessive leanness (e.g., caloric deficit, muscle loss) and obesity (e.g., metabolic dysfunction, inflammation), based on dose-response meta-analyses.

J-Shaped Blood Pressure Risk: Unlike the other metrics with linear risk trends, systolic and diastolic blood pressure metrics use a J-shaped risk model where mortality risk is lowest near an optimal "nadir" (around 125 mmHg systolic and 75 mmHg diastolic). Values that are either too high or too low increase risk, and the percentile scoring reflects deviation magnitude from this nadir rather than simple linear scaling.

Age-Specific Mortality Baseline: Baseline mortality rates use precise WHO/actuarial life table data with linear interpolation between age points, replacing exponential approximations. This provides accurate age-adjusted risk calculations from age 20-95+ years.

Comorbidity Adjustment: Medical conditions (diabetes, heart disease, cancer) reduce fitness benefits by 15-50% based on clinical evidence, as underlying pathophysiology limits the protective effects of physical fitness on mortality outcomes.

Factor-Based Correlation Adjustment: Metrics are grouped by biological pathways (cardiovascular, strength, body composition, functional) rather than simple pairwise correlations. When multiple metrics within the same factor are entered, cumulative ARR is proportionally reduced to prevent double-counting shared physiological mechanisms.

Cumulative Risk: Individual ARR values are summed after correlation and comorbidity adjustments, then converted back to relative risk reduction using age-specific baseline mortality rates. This prevents mathematical overcounting while maintaining biological realism.

Weighting System: Metrics are weighted 1-3 based on their predictive strength for all-cause mortality in the literature, with VO₂ max, body composition, and functional tests receiving highest weights (3), strength measures moderate weights (2), and cardiovascular parameters lower weights (1).

Scientific References for Mortality Risk Ranges by Metric

Metric Year Key Findings on ACM Range Document
Coopertest (VO2Max) 2009 Each 1-MET (3.5 ml/kg/min) increase linked to 13% lower all-cause mortality; >35 ml/kg/min in 50-59 group is optimal Cardiorespiratory fitness as a quantitative predictor of all-cause mortality and cardiovascular events in healthy men and women: a meta-analysis JAMA 2009
Body Fat % 2022 Lowest mortality at 20-25% body fat; each 5% increase above 25% raises mortality by 10% Body fat and risk of all-cause mortality: a systematic review and dose-response meta-analysis of prospective cohort studies Nat Commun 2022
Waist-to-Hip Ratio 2011 One SD increase (0.08) predicts 15% higher all-cause mortality; target <0.90 in men Body mass index, waist circumference and waist–hip ratio: which is the better discriminator of cardiovascular disease mortality risk? Evidence from an individual-participant meta-analysis of 82 864 participants from nine cohort studies Int J Epidemiol 2011
Resting Heart Rate 2015 Each 10 bpm higher is associated with 9% higher all-cause mortality; optimal <70 bpm Resting heart rate and all-cause and cardiovascular mortality in the general population: a dose-response meta-analysis of prospective cohort studies Medicine (Baltimore) 2015
Systolic Blood Pressure 2018 Mortality lowest at 120-130 mm Hg; risk increases above 140 or below 110 Blood pressure and all-cause mortality: a systematic review and meta-analysis BMJ 2018
Diastolic Blood Pressure 2017 J-curve: DBP <70 or >90 mm Hg raises mortality; nadir 75 mm Hg Diastolic blood pressure and adverse outcomes in the elderly with systolic heart failure J Am Coll Cardiol 2017
Handgrip Strength 2022 Highest tertile (>40 kg) has 41% lower all-cause mortality; lowest tertile (<30 kg) highest risk Handgrip strength and all-cause mortality: a systematic review and meta-analysis Sports Med 2022
30 s Arm Curl 2022 >18 reps linked to 30% lower functional-decline mortality risk; <12 reps elevated risk Upper-limb muscle strength and mortality in older adults: a systematic review and meta-analysis Geroscience 2022
30 s Chair Rises 2022 >17 reps optimal; <12 reps associated with 20% higher mortality The 30-second chair stand test as a predictor of mortality in older adults J Aging Phys Act 2022
8-Foot Up-and-Go 2022 <8 s optimal; >10 s linked to 30% higher all-cause mortality Timed Up and Go test and mortality in older adults Clin Interv Aging 2022
Sit-and-Reach 2024 >5 cm optimal; <0 cm linked to 40% higher mortality over 10 years Flexibility and all-cause mortality in adults: a systematic review J Gerontol A 2024
Sitting-Rising Test 2025 >8 points optimal; <4 points associated with 4-fold higher mortality Sitting-rising test as a predictor of mortality: a cohort study Eur J Prev Cardiol 2025
Daily Step Count 2018 8,000 steps/day linked to 55% lower all-cause mortality; <4,000 steps highest risk Association of cardiorespiratory fitness with long-term mortality among adults undergoing treadmill exercise testing JAMA Netw Open 2018
Push-up Capacity 2019 >40 reps associated with 96% lower CVD mortality; <10 reps highest risk Association between push-up exercise capacity and future cardiovascular events among active adult men JAMA Netw Open 2019
Notes: References focus on middle-aged cohorts where data available. Some indirect estimates due to limited direct ACM studies.